In the era of hyper-scale computation, edge virtualization, and deep learning neural networks, the concept of Server Monitoring Tools has undergone a paradigm shift. Historically confined to application-level monitoring agents (such as Prometheus exporters or APMs), modern enterprise infrastructures now demand silicon-level, real-time diagnostic insight. Integrated Baseboard Management Controllers (BMCs), custom hardware sensors, and Redfish-compliant management platforms form the foundational architecture of contemporary server telemetry.
Globally, server farms and high-density GPU clusters are experiencing unprecedented thermal densities, dynamic load spikes, and critical power fluctuations. The expansion of AI workloads—characterized by sudden shifts in memory throughput, extreme current demands (di/dt variations), and accelerated wear on high-capacity SSDs—requires unified physical-to-virtual monitoring tools. Modern China server manufacturers and factories have transitioned from simple metal fabrication and PCB assembly to pioneering complex software-defined hardware management ecosystems. These tools continuously audit system voltages, thermal thresholds, and physical media integrity, mitigating system crashes before they occur at the software layers.
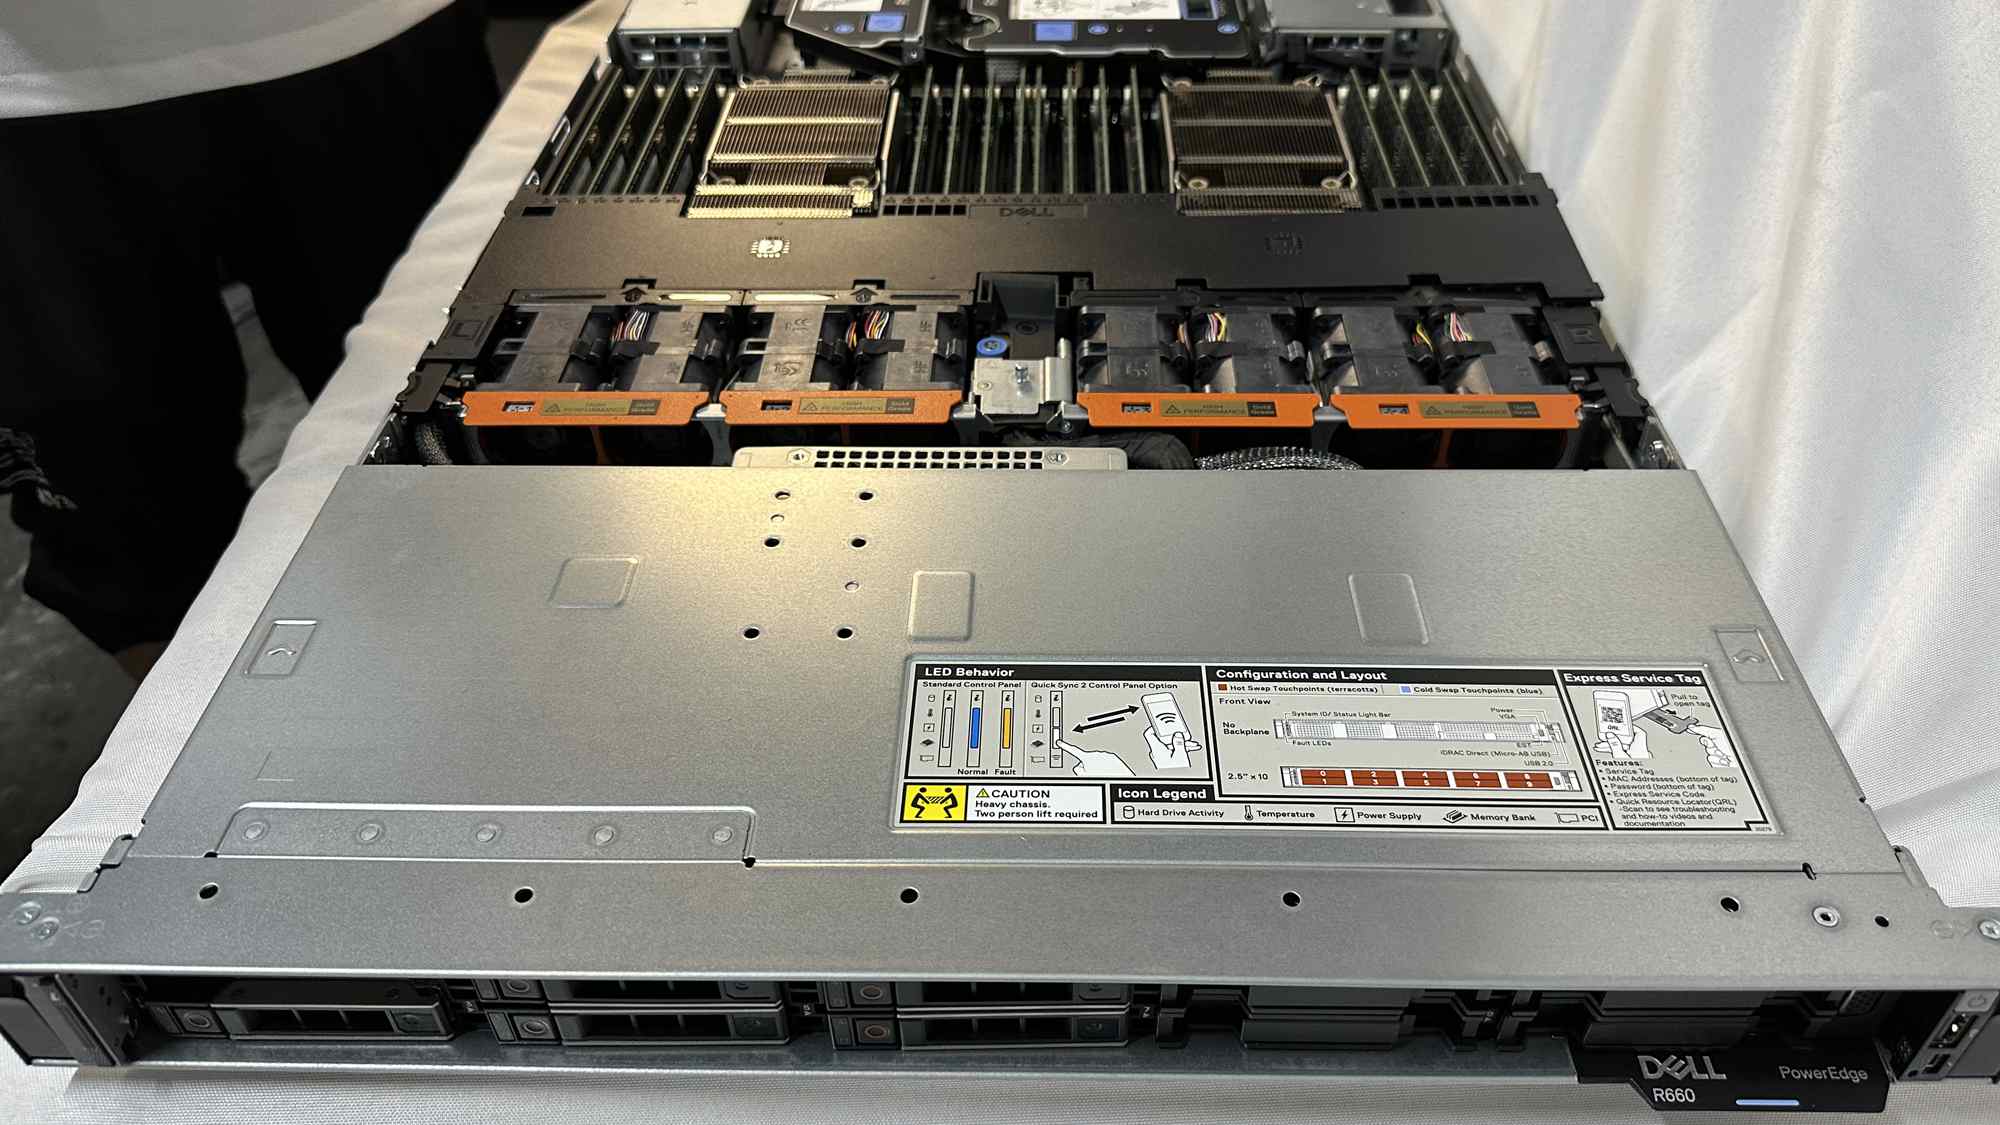
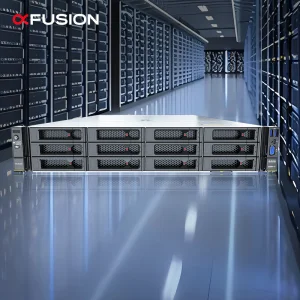
In international trade, buyers no longer select bare-metal servers based purely on compute power; they evaluate the built-in out-of-band management tooling. The inclusion of enterprise-tier, silicon-embedded monitoring systems (such as xFusion's iBMC, Dell's iDRAC, and customized OpenBMC layers) defines the operational efficiency, Mean Time Between Failures (MTBF), and Overall Equipment Effectiveness (OEE) of modern computing facilities.
The server monitoring landscape is rapidly evolving around three major industrial trends:
A. Transition to OpenBMC and Redfish APIs: The industry is steadily moving away from proprietary, vendor-locked out-of-band platforms. Modern datacenters favor OpenBMC implementations due to their transparency, high customizability, and lack of license fees. Redfish APIs have superseded antiquated IPMI 2.0 protocols, offering JSON-based payloads over secure HTTPS connections. This allows infrastructure engineers to programmatically query hardware statuses, execute remote firmware flashes, and retrieve thermal arrays across thousands of physical server nodes simultaneously.
B. AI-Optimized GPU and VRAM Diagnostics: Standard CPU-centric thermal management is inadequate for high-density AI nodes. Telemetry tools must track microsecond-level changes in GPU core temperature, HBM3e stack temperatures, and NVLink bandwidth utilization. Real-time monitoring tools must interact dynamically with the hypervisor to throttle or load-balance workloads when thermal saturation limits are approached, preventing silicon degradation.
C. Predictive Maintenance and Wear-Level Analytics: Modern telemetry agents analyze persistent SMART parameters on NVMe/SATA SSDs, ECC memory error corrections, and RAID cache capacitor states. Through predictive machine learning models integrated within the management suite, the hardware platform can notify system administrators to hot-swap a degrading disk or an array card cache unit long before a catastrophic failure occurs.
Enabling standardized, open-source out-of-band management protocols across heterogenous computing clusters without proprietary vendor lock-in.
Executing scalable HTTPS JSON API queries for automated infrastructure orchestration, telemetry gathering, and dynamic configuration.
Leveraging continuous machine learning diagnostics on physical storage arrays, ECC memory, and power delivery components.
For global organizations seeking secure, stable, and telemetrically optimized computing platforms, TensorNova stands as a premier manufacturing partner. Established in 2016 and backed by over 12 years of industry experience in AI computing and server manufacturing, TensorNova operates at the vanguard of high-performance hardware and diagnostic integration.
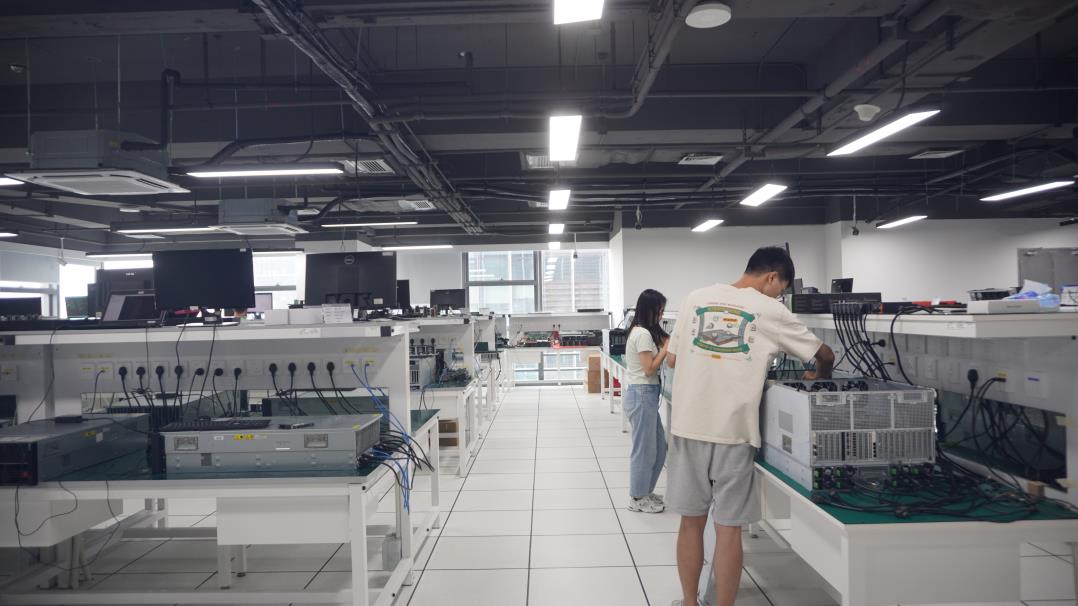
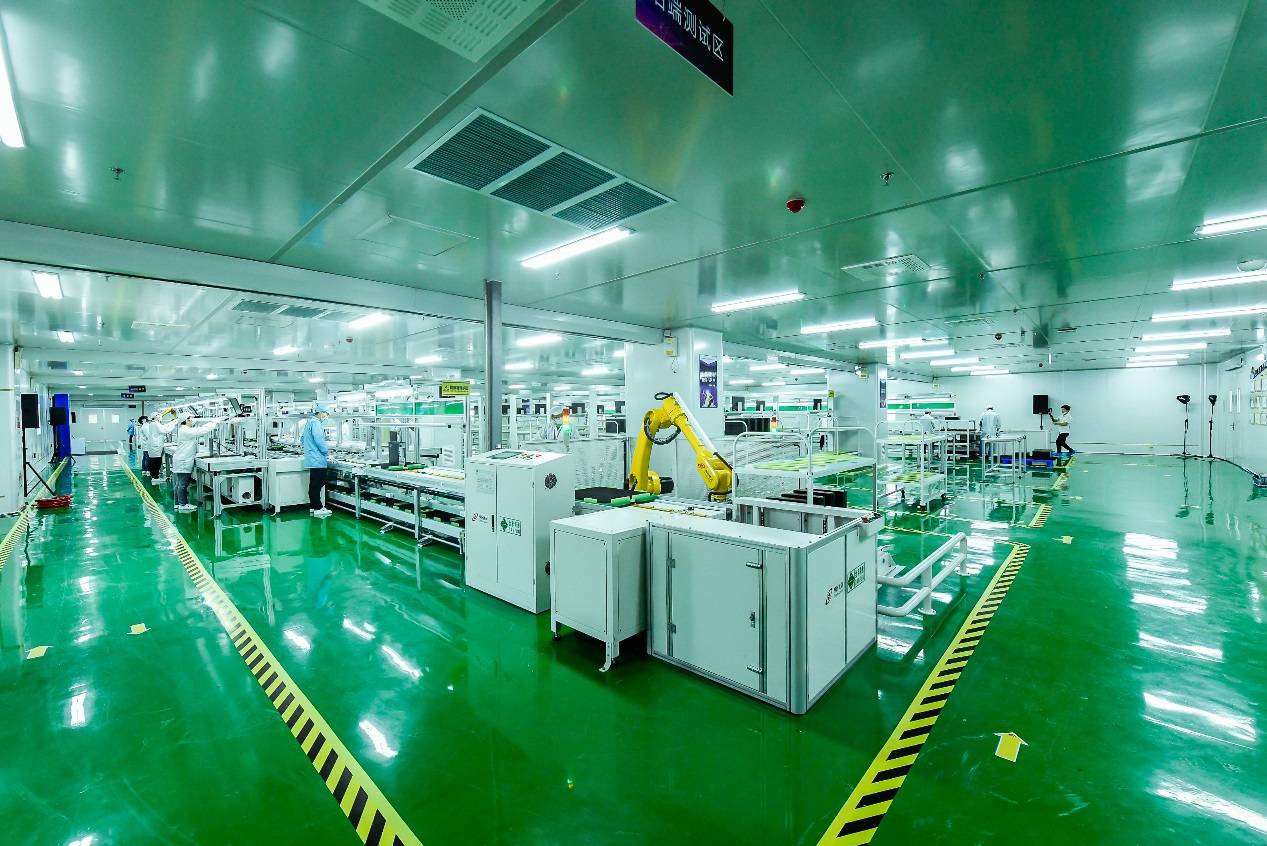
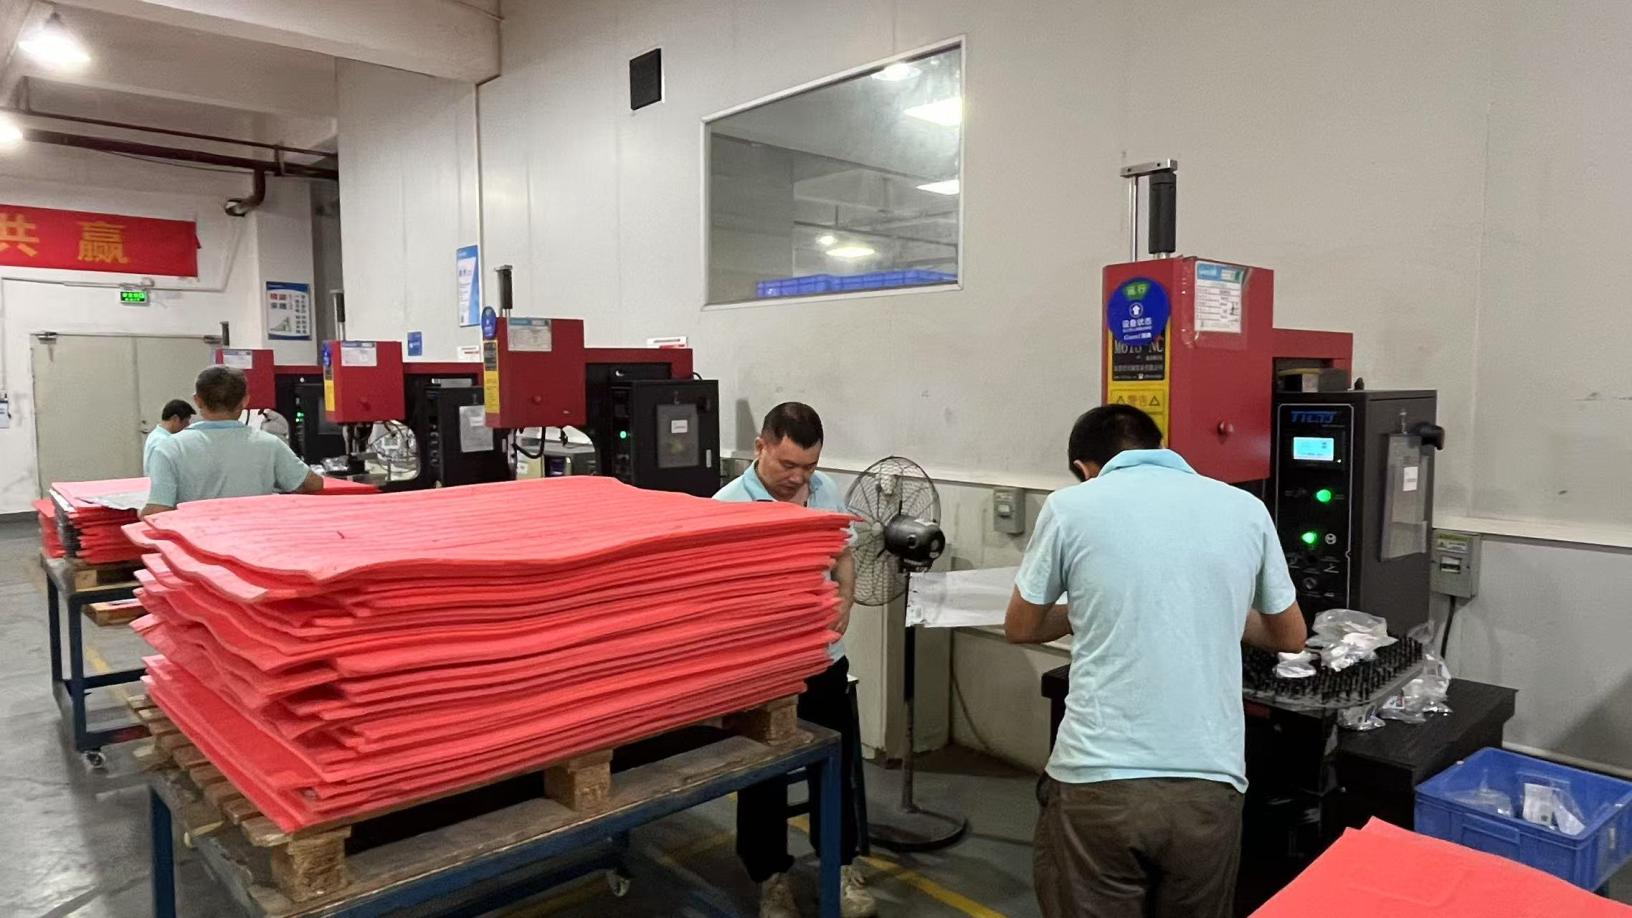
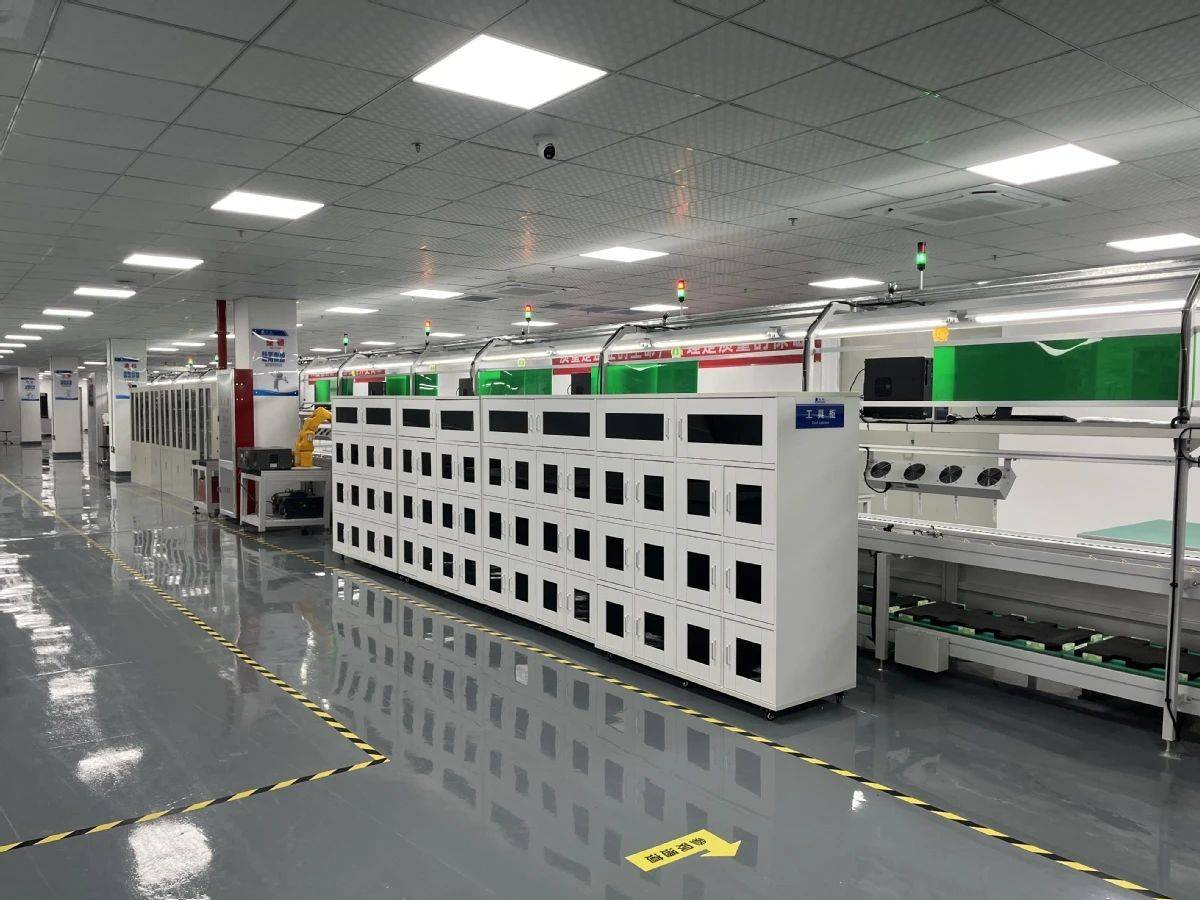
Operating out of a modern, specialized production facility covering 320㎡ dedicated to advanced server assembly, precision component integration, and system validation, TensorNova has built a robust supply chain ecosystem with more than 1,200 global suppliers and strategic component partners. The company maintains an annual export revenue of approximately $8.5 million across 6 years of export experience, serving enterprise IT departments, AI research institutions, cloud computing providers, and AI startups across North America, Europe, Southeast Asia, and the Middle East—with key hubs in the United States, Germany, Singapore, and the United Arab Emirates.
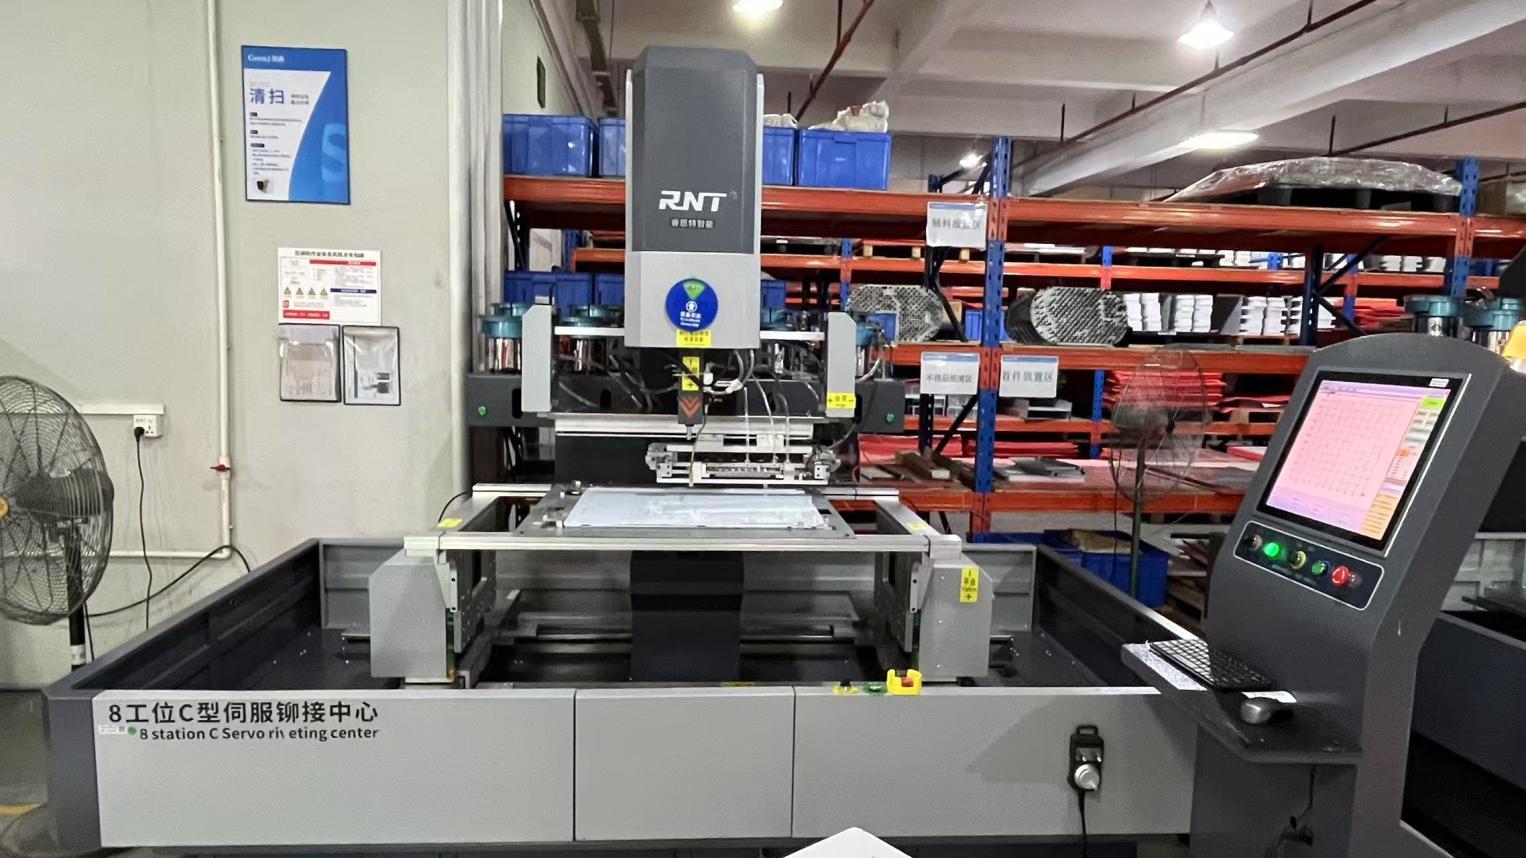
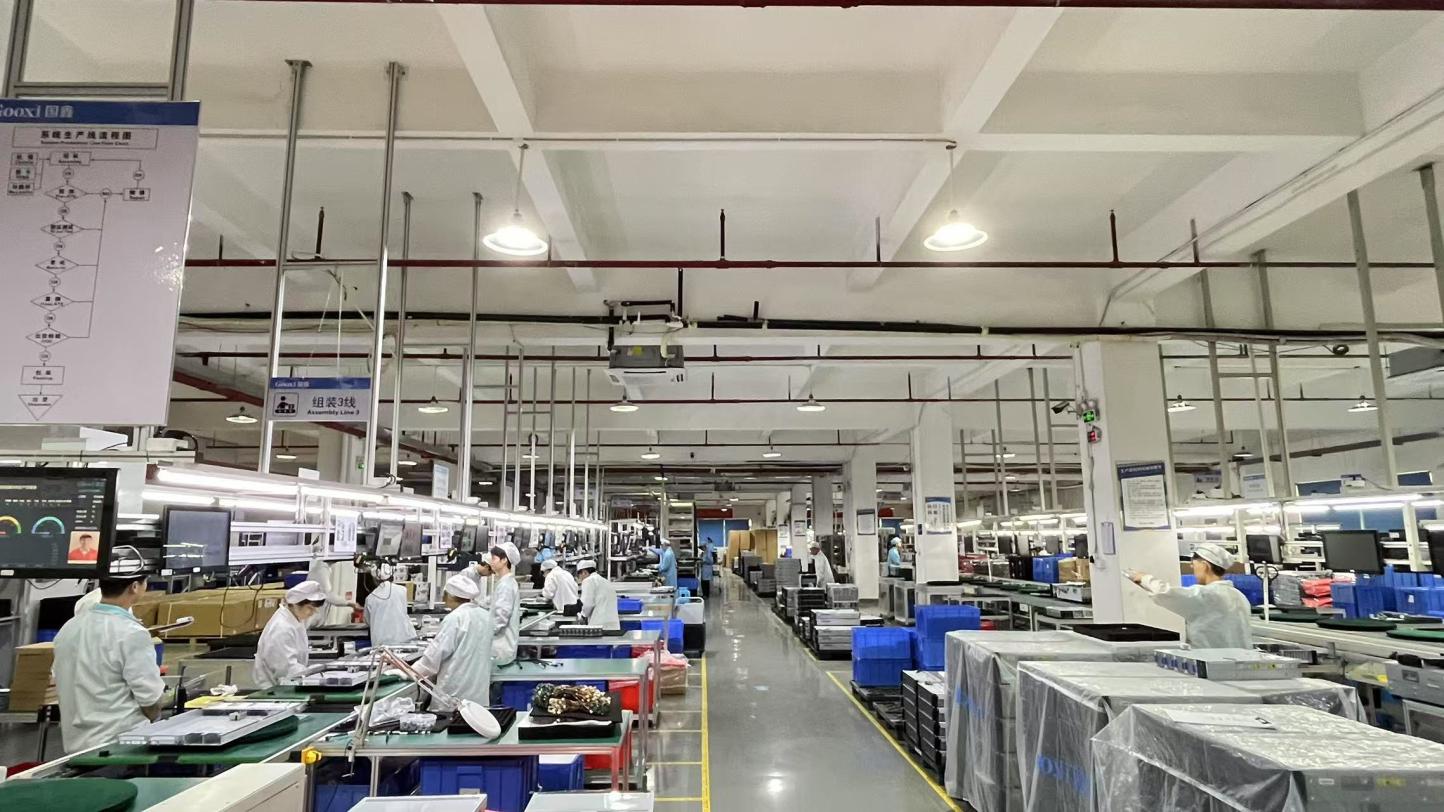
Quality assurance at TensorNova is built on strict ISO9001-based quality management systems. Every computing node undergoes rigorous, automated hardware stress testing, thermal performance validation, electrical burn-in testing, and simulation of high-density AI workloads. Backed by a dedicated QC team of 45 quality control personnel and an engineering core of 180 R&D engineers, TensorNova ensures every hardware platform—whether standard 1U/2U servers or liquid-cooled GPU clusters—is fully prepared for advanced monitoring, integration with OpenBMC, and high-intensity continuous runtime operations. In the past year alone, TensorNova successfully designed and deployed 320+ new products, highlighting its rapid adaptation to evolving enterprise demands.

Enterprise infrastructure deployment requires specialized, domain-specific hardware telemetry designs:
Scenario A: High-Density AI Computing Labs and GPU Farms: Here, server power consumption fluctuates rapidly. Traditional out-of-band monitoring systems fail to react quickly enough. TensorNova's customized telemetry setups integrate with PMBus (Power Management Bus) controllers, allowing the server monitoring suite to query PSU registers directly. This guarantees sub-millisecond logging of electrical load spikes, allowing datacenter orchestrators to distribute containerized AI workloads across nodes, preventing local power outages.
Scenario B: Unattended Remote Edge Nodes: For installations at rural cell towers or distributed edge branches, physical maintenance is costly. In these environments, servers depend on comprehensive out-of-band remote administration. Built-in remote diagnostic tools monitor ambient humidity, dust buildup, chassis intrusion, and PCIe link integrity. If an array card cache battery starts to fail, the node automatically reports the event to the centralized corporate operations center via encrypted API endpoints.
Scenario C: Cloud Service Providers & Multi-Tenant Data Centers: Multi-tenant hyperscalers demand clean software boundaries for performance isolation. Here, hardware monitoring tools must support secure partition telemetry. By employing Redfish-based access control lists (ACLs), providers can securely expose specific hardware statistics—like disk endurance values and processor utilization—to tenants, maintaining full visibility without compromising overall infrastructure security.


To implement an effective infrastructure orchestration strategy, architectural engineers must understand the low-level communication channels between the hardware layer and monitoring applications. Modern enterprise servers deploy several key diagnostic interfaces:
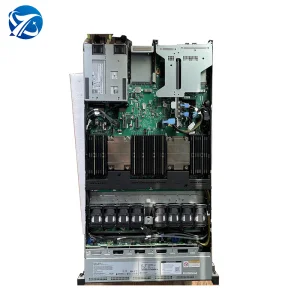
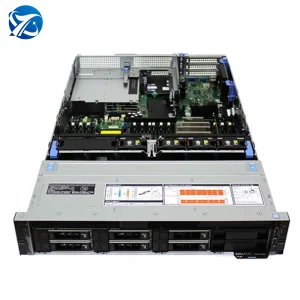
PCIe Bus and Out-of-Band SMBus Connectivity: Peripheral components (like SAS/SATA RAID host bus adapters, high-speed fibre channel HBA cards, and enterprise SSD controllers) write their diagnostics directly to internal register tables. The Baseboard Management Controller (BMC) queries these units via SMBus or I2C sidebands. For example, if a RAID controller (like the SAS3908 processor on the XC470C-M-8i) experiences thermal saturation or an onboard flash cache battery degradation, the BMC captures this event without utilizing operating system CPU cycles.
Dynamic Thermal Zone Fan Speed Regulation: Modern server enclosures are divided into independent thermal zones. Advanced monitoring tools monitor CPU core temperatures, PCIe slot intake/exhaust gradients, and power supply temperatures. An embedded proportional-integral-derivative (PID) control algorithm adjusts fan speeds dynamically, maintaining optimal component temperatures while minimizing acoustic noise and parasitic power draw.
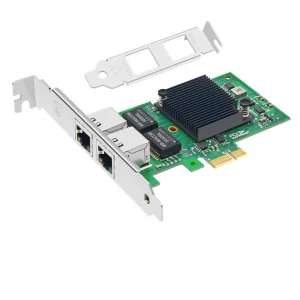
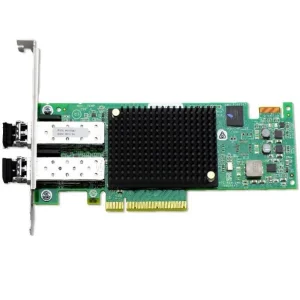
Integrated SmartNIC and Optical Link Telemetry: High-performance fibre channel host bus adapters (such as Emulex LPe35002-M2) monitor optical transmitter power, receiver power, laser bias current, and transceiver temperatures using SFF-8472 digital diagnostics. Monitoring tools analyze these statistics to identify degrading fiber-optic runs or transceiver failures before packet drops disrupt network storage targets.
IPMI 2.0 is a legacy out-of-band management standard that relies on custom binary protocols over UDP. It lacks security updates and is difficult to integrate with modern web-scale automation tools. Redfish is a RESTful API standard developed by the DMTF that serves JSON payloads over secure HTTPS connections. It makes it easier to query, configure, and automate server hardware across heterogeneous server fleets using standard programming tools like Python or Ansible.
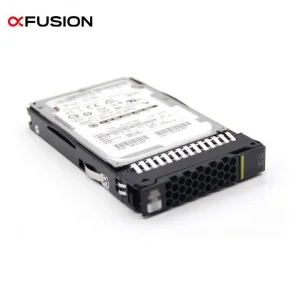
The BMC communicates with array controllers and PCIe NVMe drives through sideband interfaces (like SMBus or NVMe-MI). The controller regularly exports diagnostic data, including SSD wear levels, percentage of remaining life, write amplification metrics, and read/write error logs. This data is exposed through the BMC's WebGUI or Redfish API, allowing administrators to plan replacement cycles before drives fail.
AI workloads draw significant power, causing sudden heat spikes in GPUs, High Bandwidth Memory (HBM), and power supply units. Out-of-band telemetry operates on a dedicated chip separate from the primary CPU and operating system. If a server crashes or hangs due to a kernel panic under heavy workloads, OOB systems remain active, allowing remote power cycles, crash dump analysis, and thermal investigation.
Yes. TensorNova provides hardware-level and firmware-level customization. This includes custom OpenBMC builds, tailored thermal fan profiles for specific chassis designs, custom sensor threshold mapping, and integration with third-party orchestration APIs. Our R&D team works closely with enterprise buyers to ensure seamless compatibility with existing monitoring tools.
Modern servers allow you to deploy a BMC exporter (like the Prometheus Redfish Exporter) within your management network. This exporter queries the server BMCs via the Redfish API, parses the JSON responses into Prometheus metrics, and exposes them. From there, you can build Grafana dashboards to visualize temperatures, power draw, and fan speeds alongside your operating system metrics.
All TensorNova systems undergo strict testing. This includes environmental chamber tests under high heat and humidity, full-load electrical burn-in, system-level vibration checks, and simulated AI training workloads. These tests verify the cooling system's performance, ensuring the hardware runs reliably under continuous, high-load conditions.